London Breakout Tracker - Box Style📊 London Breakout Tracker (Pine Script v6)
This script is designed to track the Asian session range and identify breakout opportunities when the London session begins. It highlights high-probability trade setups and helps avoid fakeouts or overly wide ranges.
🧱 1. Session Time Definitions (Adjusted for Kenyan Time)
The Asian session is defined as:
3:00 AM to 11:00 AM (Kenyan Time)
🔐 2. Asian Session High & Low
During the Asian session:
The script tracks the highest high and lowest low to define the range.
These are stored in variables: asianHigh and asianLow.
🧊 3. Box Drawing for the Asian Range
Once the Asian session ends:
A visual box is drawn around the session using box.new().
This box spans from the session start to end bars and from the high to low.
It helps visually see the range price must break out from.
🚨 4. Breakout Signals
After the Asian session:
A Long Breakout signal is generated if:
The candle closes above the Asian High.
A Short Breakout signal is generated if:
The candle closes below the Asian Low.
This corresponds to 00:00 to 08:00 UTC
These are shown with:
✅ Green up label for long breakouts
❌ Red down label for short breakouts
🧯 5. Fakeout Detection
If price breaks out but closes back inside the Asian range, it’s marked as a Fakeout:
Long Fakeout: Price breaks above high, then closes back below.
Short Fakeout: Price breaks below low, then closes back above.
These are marked with orange X-crosses above or below candles.
⚠️ 6. Wide Range Filter
If the Asian session range is too wide (e.g. > 40 pips), a gray background is drawn.
This warns you not to trade that day since breakouts from wide ranges are unreliable.
📣 7. Alert Conditions
The script can trigger alerts in TradingView when:
🔔 A Long or Short Breakout occurs
⚠️ A Fakeout is detected
You can set these up via the TradingView alert system.
🎯 Overall Purpose:
The script helps you:
Clearly see the Asian session range
Identify breakout opportunities at the London open
Avoid trading during fakeouts or wide-range sessions
Get alerted when breakout/fakeout conditions occur
ค้นหาในสคริปต์สำหรับ "session high"

Advanced Session Profile Predictor with SR Boxes & ORAdvanced Session Profile Predictor with Momentum Arrows
Designed for intraday traders, this indicator analyzes price action across Asia, London, and New York sessions to predict market profiles and highlight key trading opportunities. By combining session-based profiling, Opening Range (OR) visualization, and momentum signals from Traders Dynamic Index (TDI), it offers a unique tool for anticipating trends, reversals, and breakouts. Ideal for forex, indices, and crypto on 15M–1H charts.
What Makes This Indicator Unique?
Unlike typical session indicators that only mark time zones or standard TDI scripts that focus on momentum, this tool:
Predicts market profiles (e.g., "Trend Continuation," "NY Manipulation") by analyzing session ranges and directional moves, offering actionable insights into how sessions interact.
Visualizes Opening Range (OR) boxes for the first 15 minutes of each session, helping traders spot early breakout levels.
Integrates TDI with momentum to generate precise bullish/bearish arrows, filtered by session context for improved reliability.
Simplifies decision-making with dynamic profile labels showing real-time long/short conditions based on price levels.
How Does It Work?
Session Tracking:
Asia (00:00–08:00 UTC, yellow), London (08:00–16:00 UTC, red), and New York (13:00–21:00 UTC, blue) sessions are highlighted with background colors and high/low lines (crosses).
OR boxes (first 15 minutes) are drawn for each session: yellow for Asia, red for London, blue for NY.
Profile Prediction:
Compares Asia and London session ranges and directions (e.g., trending if range > 1.5x 5-period SMA).
Examples:
Trend Continuation: Asia and London trend in the same direction—long above Asia high (uptrend) or short below Asia low (downtrend).
NY Manipulation: Asia trends, London consolidates—watch for NY breakouts at London high/low.
Displays the predicted profile and entry conditions in labels (e.g., "IF price hits 1.2000 LONG").
Momentum Arrows:
Uses TDI (RSI period 21, bands 34, fast MA 2) and 12-period momentum.
Green up arrow: Fast MA > upper band (>68) and momentum rising (bullish).
Red down arrow: Fast MA < lower band (<32) and momentum falling (bearish).
Support/Resistance (SR):
Plots dynamic SR boxes based on pivot highs/lows, filtered by volume (inspired by ChartPrime’s methodology, credited below).
How to Use It
Setup: Apply to a 15M–1H chart. Adjust time zone (default: UTC) and session times if needed. Customize TDI/momentum settings for sensitivity.
Trading:
Check the top-right labels for the current profile and entry conditions (e.g., "IF price hits LONG/SHORT").
Confirm entries with green up arrows (bullish) or red down arrows (bearish).
Use OR boxes and session high/low lines to identify breakout or reversal levels.
Example: In "NY Manipulation," wait for price to hit London high (long) or low (short) during NY session, confirmed by an arrow.
Best Markets: Forex (EUR/USD), indices (SPX500), crypto (BTC/USD) with sufficient intraday volatility.
Underlying Concepts
Session Profiling: Detects trends (range > SMA * threshold) and manipulation (e.g., London breaking Asia’s high/low) to predict NY behavior.
OR Boxes: Marks the first 15 minutes’ high/low as a breakout zone (time-based, 900,000 ms).
TDI + Momentum: Combines RSI-based bands with price change (close – close ) for momentum signals.
SR Boxes: Identifies pivots over a lookback period (default 20), scaled by ATR and filtered by volume thresholds.
Credits
The SR box logic is inspired by ChartPrime’s volume-filtered support/resistance methodology, adapted with custom breakout/hold detection. Original authors are credited for their foundational work.
Chart Setup
Displays session backgrounds, OR boxes, high/low lines, TDI arrows, and profile labels. Keep other indicators off for clarity.

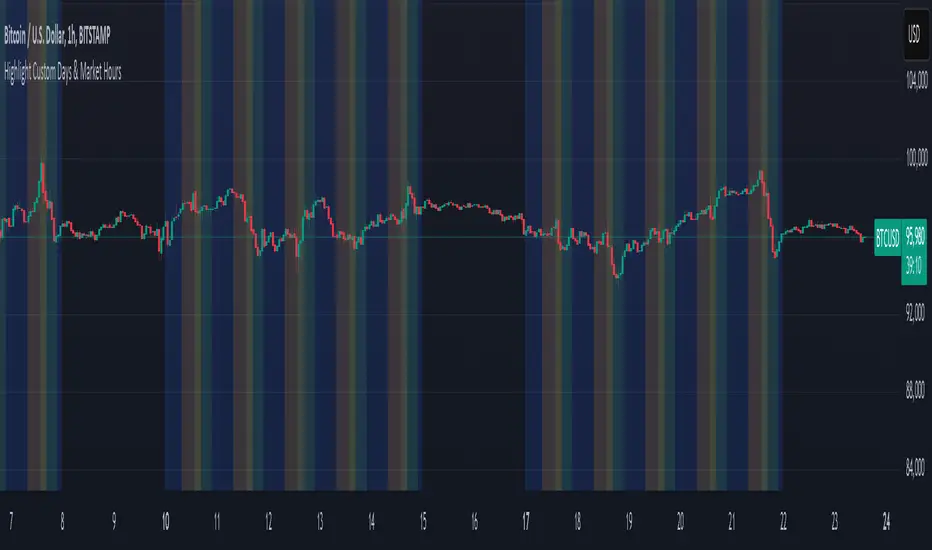
Mon to Fri + LSE and NYSE📌 Highlight Custom Days & Market Hours Indicator 📌
🔹 Overview:
This script allows traders to visually highlight specific weekdays and market sessions directly on their TradingView charts. With customizable checkboxes, you can choose which days of the week to highlight, along with session times for the New York Stock Exchange (NYSE) and London Stock Exchange (LSE).
🔹 Features:
✅ Select individual weekdays (Monday–Friday) to highlight in blue
✅ Highlight NYSE open hours (2:30 PM – 9:30 PM UK time) in green
✅ Highlight LSE open hours (8:00 AM – 4:30 PM UK time) in orange
✅ Ensures NYSE & LSE sessions are only highlighted on weekdays (no weekends)
✅ Clean and simple visualization for enhanced market awareness
🔹 How to Use:
1️⃣ Add the indicator to your TradingView chart
2️⃣ Use the settings panel to enable/disable specific weekdays
3️⃣ Toggle NYSE or LSE session highlights based on your trading preference
🚀 Perfect for traders who follow institutional sessions and want better time-based confluence in their strategies!
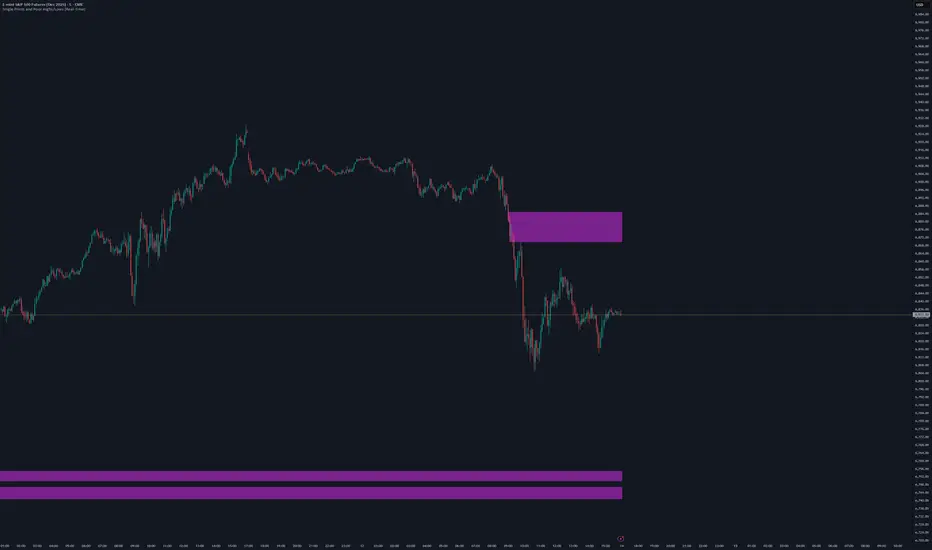
One Trading Setup for Life ICT [TradingFinder] Sweep Session FVG🔵 Introduction
ICT One Trading Setup for Life is a trading strategy based on liquidity and market structure shifts, utilizing the PM Session Sweep to determine price direction. In this strategy, the market first forms a price range during the PM Session (from 13:30 to 16:00 EST), which includes the highest high (PM Session High) and lowest low (PM Session Low).
In the next session, the price first touches one of these levels to trigger a Liquidity Hunt before confirming its trend by breaking the Change in State of Delivery (CISD) Level. After this confirmation, the price retraces toward a Fair Value Gap (FVG) or Order Block (OB), which serve as the best entry points in alignment with liquidity.
In financial markets, liquidity is the primary driver of price movement, and major market participants such as institutional investors and banks are constantly seeking liquidity at key levels. This process, known as Liquidity Hunt or Liquidity Sweep, occurs when the price reaches an area with a high concentration of orders, absorbs liquidity, and then reverses direction.
In this setup, the PM Session range acts as a trading framework, where its highs and lows function as key liquidity zones that influence the next session’s price movement. After the New York market opens at 9:30 EST, the price initially breaks one of these levels to capture liquidity.
However, for a trend shift to be confirmed, the CISD Level must be broken.
Once the CISD Level is breached, the price retraces toward an FVG or OB, which serve as optimal trade entry points.
Bullish Setup :
Bearish Setup :
🔵 How to Use
In this strategy, the PM Session range is first identified, which includes the highest high (PM Session High) and lowest low (PM Session Low) between 13:30 and 16:00 EST. In the following session, the price touches one of these levels for a Liquidity Hunt, followed by a break of the Change in State of Delivery (CISD) Level. The price then retraces toward a Fair Value Gap (FVG) or Order Block (OB), creating a trading opportunity.
This process can occur in two scenarios : bearish and bullish setups.
🟣 Bullish Setup
In a bullish scenario, the PM Session High and PM Session Low are identified. In the following session, the price first breaks the PM Session Low, absorbing liquidity. This process results in a Fake Breakout to the downside, misleading retail traders into taking short positions.
After the Liquidity Hunt, the CISD Level is broken, confirming a trend reversal. The price then retraces toward an FVG or OB, offering an optimal long entry opportunity.
The initial take-profit target is the PM Session High, but if higher timeframe liquidity levels exist, extended targets can be set.
The stop-loss should be placed below the Fake Breakout low or the first candle of the FVG.
🟣 Bearish Setup
In a bearish scenario, the market first defines its PM Session High and PM Session Low. In the next session, the price initially breaks the PM Session High, triggering a Liquidity Hunt. This movement often causes a Fake Breakout, misleading retail traders into taking incorrect positions.
After absorbing liquidity, the CISD Level breaks, indicating a shift in market structure. The price then retraces toward an FVG or OB, offering the best short entry opportunity.
The initial take-profit target is the PM Session Low, but if additional liquidity exists on higher timeframes, lower targets can be considered.
The stop-loss should be placed above the Fake Breakout high or the first candle of the FVG.
🔵 Setting
CISD Bar Back Check : The Bar Back Check option enables traders to specify the number of past candles checked for identifying the CISD Level, enhancing CISD Level accuracy on the chart.
Order Block Validity : The number of candles that determine the validity of an Order Block.
FVG Validity : The duration for which a Fair Value Gap remains valid.
CISD Level Validity : The duration for which a CISD Level remains valid after being broken.
New York PM Session : Defines the PM Session range from 13:30 to 16:00 EST.
New York AM Session : Defines the AM Session range from 9:30 to 16:00 EST.
Refine Order Block : Enables finer adjustments to Order Block levels for more accurate price responses.
Mitigation Level OB : Allows users to set specific reaction points within an Order Block, including: Proximal: Closest level to the current price. 50% OB: Midpoint of the Order Block. Distal: Farthest level from the current price.
FVG Filter : The Judas Swing indicator includes a filter for Fair Value Gap (FVG), allowing different filtering based on FVG width: FVG Filter Type: Can be set to "Very Aggressive," "Aggressive," "Defensive," or "Very Defensive." Higher defensiveness narrows the FVG width, focusing on narrower gaps.
Mitigation Level FVG : Like the Order Block, you can set price reaction levels for FVG with options such as Proximal, 50% OB, and Distal.
Demand Order Block : Enables or disables bullish Order Block.
Supply Order Block : Enables or disables bearish Order Blocks.
Demand FVG : Enables or disables bullish FVG.
Supply FVG : Enables or disables bearish FVGs.
Show All CISD : Enables or disables the display of all CISD Levels.
Show High CISD : Enables or disables high CISD levels.
Show Low CISD : Enables or disables low CISD levels.
🔵 Conclusion
The ICT One Trading Setup for Life is a liquidity-based strategy that leverages market structure shifts and precise entry points to identify high-probability trade opportunities. By focusing on PM Session High and PM Session Low, this setup first captures liquidity at these levels and then confirms trend shifts with a break of the Change in State of Delivery (CISD) Level.
Entering a trade after a retracement to an FVG or OB allows traders to position themselves at optimal liquidity levels, ensuring high reward-to-risk trades. When used in conjunction with higher timeframe bias, order flow, and liquidity analysis, this strategy can become one of the most effective trading methods within the ICT Concept framework.
Successful execution of this setup requires risk management, patience, and a deep understanding of liquidity dynamics. Traders can enhance their confidence in this strategy by conducting extensive backtesting and analyzing past market data to optimize their approach for different assets.

Sessions KillZones Library [TradingFinder]🔵 Introduction
"The Forex Trading Sessions" highlight the active periods across different markets where significant trading volume and influence on the forex market are evident. The primary trading sessions globally include the "Asian Session," "London Session," and "New York Session."
A "Kill Zone" refers to a segment within a session characterized by high trading volume and notably sharper price movements. Consequently, there's a higher probability of encountering price action setups within these zones. Traders capitalize on this phenomenon in pursuit of more successful trading outcomes.
If you aim to integrate sessions or kill zones into your indicators or strategies, utilizing this library can amplify the precision and efficiency of your Python script development.
🔵 How to Use
First, you can add the library to your code as shown in the example below:
import TFlab/SessionAndKillZoneLibrary_TradingFinder/1
🟣 Parameters
SessionDetector(Session_Name, Session_Time, KillZone_Time, Session_Show, KillZone_Show, AreaUpdate, MoreInfo, Session_Color, Info_Color) =>
Parameters:
•Session_Name (string)
•Session_Time (string)
•KillZone_Time (string)
•Session_Show (bool)
•KillZone_Show (bool)
•AreaUpdate (string)
•MoreInfo (bool)
•Session_Color (color)
•Info_Color (color)
Session_Name : You must enter the session name in this parameter.
Session_Time : Enter here the start and end time of the session, which should be based on the UTC time zone.
KillZone_Time : Enter the start and end times of the kill zone, which should be based on the UTC time zone, here.
Session_Show : You can control whether or not to show the session using this entry. You must set true to display and false to not display.
KillZone_Show : Using this input you can control whether the kill zone is displayed or not. You must set true to display and false to not display.
AreaUpdate : If you want the session to be determined based on the time and high and low of the session itself, you must enter "Session" and if you want the area to be determined based on the time and high and low of the kill zone, you must enter "Kill Zone".
MoreInfo : If you want more information, you should set this entry to true, otherwise set to false. This information includes the number of candles in the area, the length of time in the area and the volume of transactions in the area.
Session_Color : Enter your desired color to display the session at this section. It is recommended to use bright and sharp colors.
Info_Color : Enter your desired color to display more information in this section.
🔵 Function Outputs
The outputs of this function are direct and indirect.
🟣 Indirect outputs
These outputs include session display, kill zone display, and time and volume information of session or kill zone.
🟣 Direct outputs
There are 8 direct outputs, which are:
Session Time : If the Session is active, it outputs 1, and if the Session is inactive, it outputs 0.
Kill Zone Time : If the Kill Zone is active, it outputs 1, and if the Kill Zone is inactive, it outputs 0.
Open : Session opening price.
High : The highest price of the session.
Low : The lowest price of the session.
Close : The last price of the session.
Low Touch Alert : If "Area Update" is in "Kill Zone" mode, if the price reaches the lowest price of the kill zone in the same session after the end of the kill zone, this output will be true. You can use this output to create an alert.
High Touch Alert : If "Area Update" is in "Kill Zone" mode, if the price reaches the highest price of the kill zone in the same session after the end of the kill zone, this output will be true. You can use this output to create an alert.
Important : To use "Open", "High", "Low" and "Close", "Area Update" must be in "Session" mode.

Volume Profile [Makit0]VOLUME PROFILE INDICATOR v0.5 beta
Volume Profile is suitable for day and swing trading on stock and futures markets, is a volume based indicator that gives you 6 key values for each session: POC, VAH, VAL, profile HIGH, LOW and MID levels. This project was born on the idea of plotting the RTH sessions Value Areas for /ES in an automated way, but you can select between 3 different sessions: RTH, GLOBEX and FULL sessions.
Some basic concepts:
- Volume Profile calculates the total volume for the session at each price level and give us market generated information about what price and range of prices are the most traded (where the value is)
- Value Area (VA): range of prices where 70% of the session volume is traded
- Value Area High (VAH): highest price within VA
- Value Area Low (VAL): lowest price within VA
- Point of Control (POC): the most traded price of the session (with the most volume)
- Session HIGH, LOW and MID levels are also important
There are a huge amount of things to know of Market Profile and Auction Theory like types of days, types of openings, relationships between value areas and openings... for those interested Jim Dalton's work is the way to come
I'm in my 2nd trading year and my goal for this year is learning to daytrade the futures markets thru the lens of Market Profile
For info on Volume Profile: TV Volume Profile wiki page at www.tradingview.com
For info on Market Profile and Market Auction Theory: Jim Dalton's book Mind over markets (this is a MUST)
BE AWARE: this indicator is based on the current chart's time interval and it only plots on 1, 2, 3, 5, 10, 15 and 30 minutes charts.
This is the correlation table TV uses in the Volume Profile Session Volume indicator (from the wiki above)
Chart Indicator
1 - 5 1
6 - 15 5
16 - 30 10
31 - 60 15
61 - 120 30
121 - 1D 60
This indicator doesn't follow that correlation, it doesn't get the volume data from a lower timeframe, it gets the data from the current chart resolution.
FEATURES
- 6 key values for each session: POC (solid yellow), VAH (solid red), VAL (solid green), profile HIGH (dashed silver), LOW (dashed silver) and MID (dotted silver) levels
- 3 sessions to choose for: RTH, GLOBEX and FULL
- select the numbers of sessions to plot by adding 12 hours periods back in time
- show/hide POC
- show/hide VAH & VAL
- show/hide session HIGH, LOW & MID levels
- highlight the periods of time out of the session (silver)
- extend the plotted lines all the way to the right, be careful this can turn the chart unreadable if there are a lot of sessions and lines plotted
SETTINGS
- Session: select between RTH (8:30 to 15:15 CT), GLOBEX (17:00 to 8:30 CT) and FULL (17:00 to 15:15 CT) sessions. RTH by default
- Last 12 hour periods to show: select the deph of the study by adding periods, for example, 60 periods are 30 natural days and around 22 trading days. 1 period by default
- Show POC (Point of Control): show/hide POC line. true by default
- Show VA (Value Area High & Low): show/hide VAH & VAL lines. true by default
- Show Range (Session High, Low & Mid): show/hide session HIGH, LOW & MID lines. true by default
- Highlight out of session: show/hide a silver shadow over the non session periods. true by default
- Extension: Extend all the plotted lines to the right. false by default
HOW TO SETUP
BE AWARE THIS INDICATOR PLOTS ONLY IN THE FOLLOWING CHART RESOLUTIONS: 1, 2, 3, 5, 10, 15 AND 30 MINUTES CHARTS. YOU MUST SELECT ONE OF THIS RESOLUTIONS TO THE INDICATOR BE ABLE TO PLOT
- By default this indicator plots all the levels for the last RTH session within the last 12 hours, if there is no plot try to adjust the 12 hours periods until the seesion and the periods match
- For Globex/Full sessions just select what you want from the dropdown menu and adjust the periods to plot the values
- Show or hide the levels you want with the 3 groups: POC line, VA lines and Session Range lines
- The highlight and extension options are for a better visibility of the levels as POC or VAH/VAL
THANKS TO
@watsonexchange for all the help, ideas and insights on this and the last two indicators (Market Delta & Market Internals) I'm working on my way to a 'clean chart' but for me it's not an easy path
@PineCoders for all the amazing stuff they do and all the help and tools they provide, in special the Script-Stopwatch at that was key in lowering this indicator's execution time
All the TV and Pine community, open source and shared knowledge are indeed the best way to help each other
IF YOU REALLY LIKE THIS WORK, please send me a comment or a private message and TELL ME WHAT you trade, HOW you trade it and your FAVOURITE SETUP for pulling out money from the market in a consistent basis, I'm learning to trade (this is my 2nd year) and I need all the help I can get
GOOD LUCK AND HAPPY TRADING

Session ATR Progression Tracker📊 Session ATR Progression Tracker - SIYL Regression Trading Tool
Track how much of your instrument's 7-day Average True Range (ATR) has been covered during the current trading session. This indicator is specifically designed for regression traders who follow the "Stay In Your Lane" (SIYL) methodology, helping you identify when the probability of mean reversion significantly increases. If you are interested in more on that check out Rod Casselli and tradersdevgroup.com.
🎯 Key Features:
• Real-time ATR Coverage Percentage - See at a glance what percentage of the 7-day ATR has been covered in the current session
• SIYL-Optimized Thresholds - See at a glance when the instrument has achieved 80% and 100% ATR coverage, the proven thresholds where mean reversion probability increases (customizable)
• Flexible Session Modes:
- Daily: Resets at calendar day change
- Session: Uses exchange-defined trading sessions
- Custom Session: Set your exact session start/end times (perfect for futures traders and international markets)
• Visual Alerts - Color-coded display (gray → orange → red) and optional background highlighting
• Repositionable Display - Choose from 9 screen positions to avoid chart clutter
• Session Markers - Green triangles mark the start of each new session
• Detailed Stats - View current range, ATR value, session high/low, and session status
💡 Why Use This Indicator?
This tool is built around a proven concept: regression trading becomes significantly more effective once a session has achieved at least 80% of its 7-day ATR. At this threshold, the probability of price reverting to mean increases substantially, creating higher-probability trade setups for SIYL practitioners.
Benefits for regression traders:
- Identify optimal entry points when mean reversion probability is highest (≥80% ATR coverage)
- Avoid premature regression entries before adequate range has been established
- Recognize when daily moves have "earned their range" and are ripe for reversal
- Time fade-the-move and counter-trend strategies with statistical backing
- Improve win rates by trading only after proven probability thresholds are met
⚙️ Setup Instructions:
1. Add the indicator to your chart
2. Select your preferred "Reset Mode" (recommend "Custom Session" for futures/international markets)
3. If using Custom Session, enter your session times in 24-hour format (e.g., 0930-1600 for US stocks, 1700-1600 for CME futures)
4. Adjust alert thresholds if desired (default: 80% and 100% - proven SIYL thresholds)
5. Position the display where it's most visible on your chart
📈 Works Across All Markets:
Stocks • Futures • Forex • Indices • Crypto • Commodities
Perfect for regression traders, mean reversion specialists, and SIYL practitioners who want to trade with probability on their side by entering only after the session has "earned its range."
---
Tip: For futures contracts with overnight sessions that span calendar days (like MES, MNQ, MYM), use "Custom Session" mode with your exchange's official session times for accurate tracking.

MP SESSIONS, DST, OTTHere’s a clear description you can use for this script (for yourself or as a TradingView “Indicator Description”):
---
### MP SESSIONS, DST, OTT – What this indicator does
This script is a **multi-session market timing tool** that:
1. **Draws full trading sessions on the chart** (Asia, Sydney, Tokyo, Shanghai, Europe, London, New York, NYSE)
2. **Automatically adjusts for Daylight Saving Time (DST)** for Sydney, London, and New York
3. **Shows a live info table** with session times, DST status, and whether each session is currently open or closed
4. **Adds optional custom “OTT” vertical lines** at user-defined intraday times (for your own models, killzones, or time blocks)
---
### Main Features (high level)
#### 1. Market mode & time zone handling
* **Market Mode**:
* `Forex`
* `Stock`
* `User Custom` (you type your own session ranges)
* `TFlab suggestion` (predefined “optimized” session times)
* **Time Zone Mode**:
* `UTC`
* `Session Local Time` (local exchange time: Sydney, Tokyo, London, New York etc.)
* `Your Time Zone` (converts to the user-selected TZ, e.g. `UTC-4:00`)
* Handles separate time zones for:
* Asia, Sydney, Tokyo, Shanghai, Europe, London, New York, NYSE
* Has logic to **recalculate session start/end depending on DST** and the chosen mode.
---
#### 2. Daylight Saving Time (DST) engine
The function `DST_Detector`:
* Calculates when DST **starts and ends** for:
* `Australia/Sydney`
* `Europe/London`
* `America/New_York`
* Detects the correct Sunday (2nd, 4th, etc.) for start/end using day-of-week and week counts.
* Returns `'Active'` or `'Inactive'` for each region.
* These values are then used to **shift the sessions** (e.g. New York 13:00–21:00 vs 12:00–20:00 in UTC).
The script can also **draw vertical lines** on the chart when DST starts/ends and label them:
* “Sydney DST Started / Ended”
* “London DST Started / Ended”
* “New York DST Started / Ended”
---
#### 3. Session timing & sessions on the chart
The function `Market_TimeZone_Calculator`:
* Based on **Market Mode** + **Time Zone Mode** + **DST state**, it returns:
* Time ranges for: Sydney, Tokyo, Shanghai, Asia (combined), Europe, London, New York, NYSE
* These ranges are in `"HHMM-HHMM"` format.
Then the script:
* Converts these to `time()` conditions using the proper time zone
* Creates boolean series like `On_sesAsia`, `On_sesEurope`, `On_sesNewYork`, etc., which are **1 when the session is open and 0 when closed**.
---
#### 4. Session high/low boxes & labels
The function `LowHighSessionDetector`:
* Tracks **high and low of each session** while it’s active.
* When a new session starts:
* Resets and starts recording the session high/low.
* While session is active:
* Updates `High` with the max of current bar high and previous session high.
* Updates `Low` with the min of current bar low and previous session low.
* When the session is "on":
* Draws a **box** from session low to high (`box.new`) and extends it to the right as long as the session continues.
* Places a **label with session name** (Asia, London, New York, etc.) near the high:
* Style depends on the session (down/right/left).
You have visibility toggles per session:
* `Asia Session`, `Sydney Session`, `Tokyo Session`, `Shanghai Session`, `Europe Session`, `London Session`, `New York Session`, `NYSE` (for TFlab mode).
So you visually see:
* A shaded box for each session
* The full H/L range for that session
* A text label with the session name.
---
#### 5. Info table
The indicator builds a **table in a corner of the chart** showing:
* Header:
* “FOREX Session”, “Stock Market Trading Hours”, “User Custom Session”, or “TFlab suggestion” depending on mode.
* Columns:
1. Session name (Asia, Sydney, Tokyo, Shanghai, Europe, London, New York, NYSE)
2. DST status for that region (“Active 🌞 / Inactive 🍂 / Not Observed”)
3. Session **start time**
4. Session **end time**
5. Current **status** (“Open / Closed”, with green/red background)
The function `SplitFunction`:
* Parses the `"HHMM-HHMM"` strings for each session.
* Converts them into:
* Either raw times (if viewing in UTC/session local)
* Or converted times in **Your Time Zone** using `timestamp` and `hour/ minute` with `YourTZ`.
* Returns formatted `Start` and `End` strings like `9:30`, `13:00`, etc.
So the table is effectively a **live session schedule** that:
* Auto-adjusts to DST
* Can show times in your own time zone
* Shows which session is open right now.
---
#### 6. OTT vertical lines (custom intraday markers)
At the bottom, there is an **OTT section** which lets you draw up to **three sets of vertical lines** at specific times:
* Each OTT block has:
* Enable toggle (`Enable OTT 1/2/3`)
* Start hour & minute
* End hour & minute
* Color
* Global OTT settings:
* Line style: `Solid / Dashed / Dotted`
* Line width
* Toggle: “Show OTT Labels?”
Logic:
* `is_ott_time()` checks if current bar’s `hour` and `minute` match the OTT input time.
* `draw_ott()`:
* When the bar time matches, draws a **vertical line** through the candle from low to high (`extend.both`).
* Optionally adds a label above the bar, like `"OTT1 Start"`, `"OTT1 End"`, etc.
Use cases:
* Marking **open/close of your trading session**
* Defining **killzones**, news times, or custom model windows
* Visual anchors for your intraday routine (NY open, 10 AM candle, etc.)
---
### TL;DR
This indicator is a **session toolkit + DST engine + time markers**:
* **Visually paints the main global sessions** with boxes and labels.
* **Handles DST automatically** for Sydney, London, New York.
* **Shows a live table** with session times, DST status, and open/closed status in your time zone.
* **Adds up to three configurable vertical time markers (OTT)** for custom session windows or key times.
If you want, I can also write a **short version** (2–3 sentences) for the TradingView “Description” field.

MP SESSIONS, DST, OTTMP SESSIONS, DST, OTT – What this indicator does
This script is a multi-session market timing tool that:
Draws full trading sessions on the chart (Asia, Sydney, Tokyo, Shanghai, Europe, London, New York, NYSE)
Automatically adjusts for Daylight Saving Time (DST) for Sydney, London, and New York
Shows a live info table with session times, DST status, and whether each session is currently open or closed
Adds optional custom “OTT” vertical lines at user-defined intraday times (for your own models, killzones, or time blocks)
Main Features (high level)
1. Market mode & time zone handling
Market Mode:
Forex
Stock
User Custom (you type your own session ranges)
TFlab suggestion (predefined “optimized” session times)
Time Zone Mode:
UTC
Session Local Time (local exchange time: Sydney, Tokyo, London, New York etc.)
Your Time Zone (converts to the user-selected TZ, e.g. UTC-4:00)
Handles separate time zones for:
Asia, Sydney, Tokyo, Shanghai, Europe, London, New York, NYSE
Has logic to recalculate session start/end depending on DST and the chosen mode.
2. Daylight Saving Time (DST) engine
The function DST_Detector:
Calculates when DST starts and ends for:
Australia/Sydney
Europe/London
America/New_York
Detects the correct Sunday (2nd, 4th, etc.) for start/end using day-of-week and week counts.
Returns 'Active' or 'Inactive' for each region.
These values are then used to shift the sessions (e.g. New York 13:00–21:00 vs 12:00–20:00 in UTC).
The script can also draw vertical lines on the chart when DST starts/ends and label them:
“Sydney DST Started / Ended”
“London DST Started / Ended”
“New York DST Started / Ended”
3. Session timing & sessions on the chart
The function Market_TimeZone_Calculator:
Based on Market Mode + Time Zone Mode + DST state, it returns:
Time ranges for: Sydney, Tokyo, Shanghai, Asia (combined), Europe, London, New York, NYSE
These ranges are in "HHMM-HHMM" format.
Then the script:
Converts these to time() conditions using the proper time zone
Creates boolean series like On_sesAsia, On_sesEurope, On_sesNewYork, etc., which are 1 when the session is open and 0 when closed.
4. Session high/low boxes & labels
The function LowHighSessionDetector:
Tracks high and low of each session while it’s active.
When a new session starts:
Resets and starts recording the session high/low.
While session is active:
Updates High with the max of current bar high and previous session high.
Updates Low with the min of current bar low and previous session low.
When the session is "on":
Draws a box from session low to high (box.new) and extends it to the right as long as the session continues.
Places a label with session name (Asia, London, New York, etc.) near the high:
Style depends on the session (down/right/left).
You have visibility toggles per session:
Asia Session, Sydney Session, Tokyo Session, Shanghai Session, Europe Session, London Session, New York Session, NYSE (for TFlab mode).
So you visually see:
A shaded box for each session
The full H/L range for that session
A text label with the session name.
5. Info table
The indicator builds a table in a corner of the chart showing:
Header:
“FOREX Session”, “Stock Market Trading Hours”, “User Custom Session”, or “TFlab suggestion” depending on mode.
Columns:
Session name (Asia, Sydney, Tokyo, Shanghai, Europe, London, New York, NYSE)
DST status for that region (“Active 🌞 / Inactive 🍂 / Not Observed”)
Session start time
Session end time
Current status (“Open / Closed”, with green/red background)
The function SplitFunction:
Parses the "HHMM-HHMM" strings for each session.
Converts them into:
Either raw times (if viewing in UTC/session local)
Or converted times in Your Time Zone using timestamp and hour/ minute with YourTZ.
Returns formatted Start and End strings like 9:30, 13:00, etc.
So the table is effectively a live session schedule that:
Auto-adjusts to DST
Can show times in your own time zone
Shows which session is open right now.
6. OTT vertical lines (custom intraday markers)
At the bottom, there is an OTT section which lets you draw up to three sets of vertical lines at specific times:
Each OTT block has:
Enable toggle (Enable OTT 1/2/3)
Start hour & minute
End hour & minute
Color
Global OTT settings:
Line style: Solid / Dashed / Dotted
Line width
Toggle: “Show OTT Labels?”
Logic:
is_ott_time() checks if current bar’s hour and minute match the OTT input time.
draw_ott():
When the bar time matches, draws a vertical line through the candle from low to high (extend.both).
Optionally adds a label above the bar, like "OTT1 Start", "OTT1 End", etc.
Use cases:
Marking open/close of your trading session
Defining killzones, news times, or custom model windows
Visual anchors for your intraday routine (NY open, 10 AM candle, etc.)

Single Prints and Poor Highs/Lows [Real-Time]This indicator is designed for traders utilizing Auction Market Theory (AMT) who need real-time visibility into market structure inefficiencies. Unlike standard TPO tools that often wait for closed bars or finished sessions, this script builds a developing TPO profile tick-by-tick to identify Single Prints and Poor Highs/Lows the moment they form.
Key Features:
Real-Time Single Prints: Automatically detects and highlights areas of single-print inefficiencies (buying/selling tails) as they happen. These "ghost" boxes persist on the chart until price repairs (fills) them, acting as immediate targets or support/resistance zones.
Poor High/Low Detection: Strictly implements AMT logic to identify "unfinished" auctions. If a session extreme is formed by two or more TPO blocks (indicating a flat top/bottom rather than a rejection tail), it marks the level with a dotted line.
Repair Logic: Both Single Prints and Poor High/Low lines are dynamic. If price revisits and repairs the structure, the markers automatically vanish to keep your chart clean.
Session Control: Fully customizable RTH (Regular Trading Hours) session input (default 08:30–15:15) to ensure profiles are built on relevant liquidity.
Quantization: Adjustable "Ticks per Block" allowing you to tune the sensitivity of the TPO profile to different assets (ES, NQ, CL, etc.).
How It Works:
TPO Construction: The script breaks the session into 30-minute periods (configurable) and tracks price overlap.
Single Prints: When the market expands rapidly, leaving gaps in the profile (single TPO blocks), a box is drawn. If price trades back through this box, it deletes itself.
Poor Extremes: It monitors the current session High and Low. If the extreme price level has a TPO count of ≥ 2, it is flagged as "Poor." If the extreme is a single print (count = 1), it is considered a valid tail and left unmarked.
Settings:
RTH Session: Define your specific trading session time.
TPO Period: Default is 30 minutes (standard AMT).
Ticks per Block: Controls the vertical resolution of the TPO. (Higher values = coarser profile, Lower values = more precision).
Colors: Fully customizable colors for Live Prints, Historical Prints, and Poor High/Low lines.
Usage:
Use this tool to spot immediate structural targets. A Poor High often acts as a magnet for price to revisit and "repair," while Single Prints often defend as support/resistance on the first retest.
MTF S/R Array - Full CustomA clean, institutional-style multi-timeframe support and resistance indicator designed for precision trading decisions. Plots previous and current period levels with full customization for backtesting and live trading.
━━━━━━━━━━━━━━━━━━━━━━
WHAT IT PLOTS
━━━━━━━━━━━━━━━━━━━━━━
MONTHLY
- Previous Month High / Low / Close
- Previous Month Highest Closing Price
- Current Month High / Low / Highest Close
WEEKLY
- Previous Week High / Low / Close
- Current Week High / Low
DAILY
- Previous Day High / Low / Close
- Current Day High / Low
SESSIONS (Full Session - EST)
- Asian: 7pm - 4am
- London: 3am - 12pm
- New York: 8am - 5pm
OPENING RANGE
- Monday/Tuesday combined high and low
- Clean box visualization for weekly initial balance
━━━━━━━━━━━━━━━━━━━━━━
WHY THESE LEVELS MATTER
━━━━━━━━━━━━━━━━━━━━━━
Institutions and smart money reference these key levels for:
- Liquidity targets
- Stop hunts
- Reversal zones
- Trend continuation entries
Previous period levels act as magnets for price. Current levels show where the battle is happening now.
━━━━━━━━━━━━━━━━━━━━━━
FULL CUSTOMIZATION
━━━━━━━━━━━━━━━━━━━━━━
Every level type has independent controls:
- Show/Hide Previous and Current separately
- Extend Bars - control how far each level stretches
- Line Width - adjust thickness per level
- Transparency - fade previous levels for clarity
- Colors - separate colors for High/Low vs Close
Additional settings:
- Labels on/off with size and style options
- Info table with position and size controls
- Opening range box transparency and border width
━━━━━━━━━━━━━━━━━━━━━━
HOW TO USE
━━━━━━━━━━━━━━━━━━━━━━
1. Use on lower timeframes (1m, 5m, 15m) to see HTF levels
2. Watch for price reactions at previous period highs/lows
3. Look for session high/low sweeps followed by reversals
4. Use Monday/Tuesday opening range for weekly bias and targets
5. Previous levels extend further back for backtesting context
━━━━━━━━━━━━━━━━━━━━━━
TIPS
━━━━━━━━━━━━━━━━━━━━━━
- Increase "Prev Extend Bars" on monthly/weekly to see levels across more history
- Use higher transparency on previous levels to keep chart clean
- Turn off sessions you don't trade to reduce clutter
- The info table shows all values at a glance - position it where it doesn't block price action
━━━━━━━━━━━━━━━━━━━━━━
BEST FOR
━━━━━━━━━━━━━━━━━━━━━━
- ICT / Smart Money Concepts traders
- Session-based strategies
- Swing traders using HTF levels on LTF entries
- Anyone who wants clean, customizable S/R levels
Works on Forex, Crypto, Stocks, Futures, and Indices.

Volume Peak Box📄 English Description
Overview
The Volume Peak Box indicator highlights periods of unusually high volume by identifying volume spikes using Bollinger Bands on volume and drawing a price-range box around each spike window. This provides traders with a clear visual representation of supply/demand imbalances, absorption zones, and breakout/false-break areas.
All calculations come from one unified concept: detecting statistically significant volume peaks on a locked timeframe and mapping them onto the chart.
Concept & Logic
1. Locked Timeframe Volume Analysis
Instead of using the current chart timeframe, this script allows users to lock volume analysis to any timeframe (e.g., 60m, 4H, 1D).
The script retrieves from the chosen timeframe:
Volume
High price
Low price
This allows volume structure from higher timeframes to be used while trading lower timeframes.
2. Bollinger Bands on Volume
Volume volatility is analyzed using a standard Bollinger Band model:
Basis = SMA(volume, BB length)
Upper Band = Basis + (mult × standard deviation)
When:
Volume > Upper Band
→ This bar is classified as a Volume Peak.
This approach makes the peak detection statistically meaningful, instead of simply comparing raw volume to previous bars.
3. Peak Session Detection (Continuous Peaks Form One Box)
The script tracks continuous volume peaks:
When a peak starts → begin a session
While peaks continue → extend the session
When peaks end → session closes and a box is created
For each peak session, the script records:
Start bar index
End bar index
Highest high within the session
Lowest low within the session
These values determine the box boundaries.
This allows the indicator to group related peaks into a single price zone, instead of drawing a box for every bar.
4. Drawing the Volume Peak Box
When a session ends, the script draws:
A filled box covering the full price range
From startBar → endBar
Using user-defined:
Box fill color
Border color
Each box visually marks a region where strong participation entered the market, often signaling:
Breakout validation
Absorption zones
Supply/demand imbalance
High-activity trading decisions
How to Use
Use the boxes to identify high-volume reaction zones.
When price revisits a box:
Expect strong reactions (bounce, rejection, or absorption).
When price breaks out from a box:
Can signal continuation with momentum.
Lower-timeframe entry signals become more reliable when aligned with high-timeframe volume boxes.
Recommended to lock the TF to:
60m for intraday
4H or 1D for swing trading
Why This Script Is Original
It uses Bollinger Bands on volume, not price — a less common volatility-based method for detecting volume anomalies.
It groups continuous peaks into unified zones instead of treating each spike separately.
The ability to lock the volume analysis to a higher timeframe allows multi-timeframe volume interpretation without cluttering the chart.
Boxes give traders a clean and intuitive view of volume-based “decision zones”.
🇹🇭 Thai Description — คำอธิบายภาษาไทย
ภาพรวม
อินดิเคเตอร์ Volume Peak Box ใช้การตรวจจับ “Volume Peak” โดยใช้ Bollinger Band บน Volume แล้วสร้าง “กล่องช่วงราคา” ครอบช่วงที่มี Volume สูงผิดปกติ ทำให้เห็นบริเวณที่มีแรงซื้อขายเข้ามาอย่างชัดเจน เช่น จุด Breakout, จุด Absorption, หรือเขต Supply/Demand
แนวคิดและหลักการทำงาน
1. วิเคราะห์ Volume จาก Timeframe ที่ล็อกไว้
คุณสามารถเลือก TF ที่ต้องการให้ Volume ถูกนำมาคำนวณ เช่น 60 นาที, 4 ชั่วโมง, 1 วัน
แม้คุณจะเปิดกราฟ TF เล็ก เช่น 5m แต่กล่องยังอิง volume จาก TF ที่เลือกไว้ ทำให้ได้ “โซน Volume ใหญ่” ที่แม่นยำขึ้น
2. Bollinger Band บน Volume
ใช้ SMA + ส่วนเบี่ยงเบนมาตรฐานของ Volume เพื่อหา “จุดที่ Volume สูงกว่าปกติอย่างมีนัยสำคัญ”
เงื่อนไข Peak:
Volume > Upper Bollinger Band
นี่เป็นวิธีที่ดีกว่า “เทียบกับแท่งก่อนหน้า” เพราะคิดจากสถิติของทั้งช่วง
3. รวม Peak ต่อเนื่องเป็นกล่องเดียว
ถ้า Volume Peak เกิดต่อเนื่องหลายแท่ง:
จะถูกจับรวมเป็น Peak session เดียว
ใช้ High สูงสุด และ Low ต่ำสุดของทั้ง session
เมื่อ Peak จบ → วาดกล่องช่วงราคา
เหมาะกับการหาจุดที่ตลาดมีแรงเข้าซื้อ/ขายหนักในช่วงเวลาเดียวกัน
4. วาดกล่อง Volume Peak
กล่องจะครอบ:
ช่วงแท่งเริ่มต้น → แท่งสุดท้ายของ Peak
ความสูงของกล่อง = ช่วงราคาที่มี Volume สูงผิดปกติ
กล่องสามารถใช้เป็น:
โซน Breakout/Breakdown
โซน Supply/Demand
เขตที่ราคามักมี reaction
วิธีใช้งาน
ใช้กล่องเป็น “เขตการตัดสินใจ” (Decision Zone)
ราคาแตะซ้ำมักเกิดการกลับตัวหรือความผันผวนสูง
การทะลุกล่องบ่อยครั้งนำไปสู่ขาเทรนด์ใหญ่
เหมาะกับการใช้ร่วมกับ Price Action และโครงสร้างราคา
จุดเด่น / ความเป็น Original
ใช้ Bollinger Band บน Volume (น้อยอินดี้ทำ)
รวม Peak ต่อเนื่องเป็น session เดียว
วิเคราะห์ Volume ข้าม TF ได้ โดยไม่ต้องเปลี่ยน TF บนกราฟ
ได้ “โซน Volume สำคัญ” แบบชัดเจน อ่านง่าย ไม่รกจอ

DTR & ATR with live zonesThis indicator is designed to help traders gauge the day's volatility in real-time. It compares the current Daily True Range (DTR)—the distance between the session's high and low—to the historical Average True Range (ATR).
The main purpose is to project potential price levels where the market might reach based on its average volatility. These levels (100% ATR, 150%, 200%, etc.) can be used as price targets. For instance, if you're in a long trade, you might consider taking partial or full profits as the price approaches these upper ATR extension levels. The indicator is highly customisable, allowing you to control the appearance of the ATR lines, zones, and labels to fit your charting preferences.
Core Concepts: ATR and DTR
To use this indicator effectively, it's important to understand its two main components:
Average True Range (ATR): This is a classic technical analysis indicator that measures market volatility. It calculates the average range of price movement over a specific period (e.g., 14 days). A higher ATR means the price is, on average, moving more, while a low ATR indicates less volatility. This script uses a higher timeframe ATR (e.g., Daily) to establish a stable volatility baseline for the current trading day.
Daily True Range (DTR): This is simply the difference between the current trading session's highest high and lowest low (session high - session low). It tells you how much the price has actually moved so far today.
The indicator's logic revolves around comparing the live, unfolding DTR to the historical, baseline ATR. An on-screen table conveniently shows this comparison as a percentage, to show how volatile the day has been.
How It Works: The Dynamic & Locked Mechanism
The most clever part of this indicator is how it draws the ATR levels. It operates in two distinct phases during the trading session:
Phase 1: Dynamic Expansion (Before DTR meets ATR)
At the start of the session, the DTR is small. The indicator calculates the remaining range needed to "complete" the 100% ATR level (difference = avg_atr - dtr). It then adds this remaining amount to the session high and subtracts it from the session low. This creates a "floating" 100% ATR range that expands dynamically as the session high or low is extended.
Phase 2: The Lock-in (After DTR meets or exceeds ATR)
Once the day's range (DTR) becomes equal to or greater than the avg_atr, the day has met its "expected" volatility. At this point, the levels lock in place. The indicator intelligently determines the anchor point for the locked range.
Once this primary 100% ATR range is established (either dynamically or locked), the script projects the other levels (150%, 200%, 250%, and 300%) by adding or subtracting multiples of the avg_atr from this base.
How to Use It for Trading
The primary use of this indicator is to set logical, volatility-based price targets.
Setting Profit Targets: If you enter a long position, the upper ATR levels (100%, 150%, 200%) serve as excellent areas to consider taking profits. A move to the 200% or 250% level often signifies an overextended or "exhaustion" move, making it a high-probability exit zone. For short positions, the lower ATR levels serve the same purpose.
Assessing Intraday Momentum: The on-screen table tells you how much of the expected daily range has been used. If it's early in the session and the DTR is only at 30% of the ATR, you can anticipate more significant price movement is likely to come. Conversely, if the DTR is already at 150% of ATR, the bulk of the day's move may already be complete.
Mean Reversion Signals: If the price pushes to an extreme level (e.g., 250% ATR) and shows signs of stalling (e.g., bearish divergence on an oscillator), it could signal a potential reversal or pullback, offering an opportunity for a counter-trend trade.
Key Settings
ATR Length & Smoothing Type: These settings control how the baseline ATR is calculated. The default 14 period and RMA smoothing are standard, but you can adjust them to your preference.
Session Settings: This is crucial. You must set the Market Session and Time Zone to match the primary trading hours of the asset you are analysing (e.g., "0930-1600" for the NYSE session).
Show Lines / Show Labels / Show Zones: The script gives you full control over the visual display. You can toggle each ATR level's lines, labels, and background zones individually to avoid a cluttered chart and focus only on the levels that matter to your strategy.

ICT Liquidity Sweep Asia/London 1 Trade per High & Low🧠 ICT Liquidity Sweep Asia/London — 1 Trade per High & Low
This strategy is inspired by the ICT (Inner Circle Trader) concepts of liquidity sweeps and market structure, focusing on the Asia and London sessions.
It automatically identifies liquidity grabs (sweeps) above or below key session highs/lows and enters trades with a fixed risk/reward ratio (RR).
----------------------------------------------------------------------------------
----------------------------------------------------------------------------------
⚙️ Core Logic
-Asia Session: 8:00 PM – 11:59 PM (New York time)
-London Session: 2:00 AM – 5:00 AM (New York time)
-The script marks the Asia High/Low and London High/Low ranges for each day.
-When the market sweeps above a session high → potential Short setup
-When the market sweeps below a session low → potential Long setup
-A trade is triggered when the confirmation candle closes in the opposite direction of the sweep (bearish after a high sweep, bullish after a low sweep).
-Only one trade per sweep type (1 per High, 1 per Low) is allowed per session.
----------------------------------------------------------------------------------
----------------------------------------------------------------------------------
📈 Risk Management
-Configurable Risk/Reward Target (default = 2:1)
-Configurable Position Size (number of contracts)
-Each trade uses a fixed Stop Loss (beyond the wick of the sweep) and a Take Profit calculated from the RR setting.
-All trades are automatically logged in the Strategy Tester with performance metrics.
----------------------------------------------------------------------------------
----------------------------------------------------------------------------------
💡 Features
✅ Visual session highlighting (Asia = Aqua, London = Orange)
✅ Automatic liquidity line plotting (session highs/lows)
✅ Entry & exit labels (optional visual display)
✅ Customizable RR and contract size
✅ Works on any instrument (ideal for indices, futures, or forex)
✅ Compatible with all timeframes (optimized for 1M–15M)
----------------------------------------------------------------------------------
----------------------------------------------------------------------------------
⚠️ Notes
-Best used on New York time-based charts.
-Designed for educational and backtesting purposes — not financial advice.
-Use as a foundation for further optimization (e.g., SMT confirmation, FVG filter, or time-based restrictions).
----------------------------------------------------------------------------------
----------------------------------------------------------------------------------
🧩 Recommended Use
Pair this with:
-ICT’s concepts like CISD (Change in State of Delivery) and FVGs (Fair Value Gaps)
-Higher timeframe liquidity maps
-Session bias or daily narrative filters
----------------------------------------------------------------------------------
----------------------------------------------------------------------------------
Author: jygirouard
Strategy Version: 1.3
Type: ICT Liquidity Sweep Automation
Timezone: America/New_York

Initial Balance Breakout Signals [LuxAlgo]The Initial Balance Breakout Signals help traders identify breakouts of the Initial Balance (IB) range.
The indicator includes automatic detection of IB or can use custom sessions, highlights top and bottom IB extensions, custom Fibonacci levels, and goes further with an IB forecast with two different modes.
🔶 USAGE
The initial balance is the price range made within the first hour of the trading session. It is an intraday concept based on the idea that high volume and volatility enter the market through institutional trading at the start of the session, setting the tone for the rest of the day.
The initial balance is useful for gauging market sentiment, or, in other words, the relationship between buyers and sellers.
Bullish sentiment: Price trades above the IB range.
Mixed sentiment: Price trades within the IB range.
Bearish sentiment: Price trades below the IB range.
The initial balance high and low are important levels that many traders use to gauge sentiment. There are two main ideas behind trading around the IB range.
IB Extreme Breakout: When the price breaks and holds the IB high or low, there is a high probability that the price will continue in that direction.
IB Extreme Rejection: When the price tries to break those levels but fails, there is a high probability that it will reach the opposite IB extreme.
This indicator is a complete Initial Balance toolset with custom sessions, breakout signals, IB extensions, Fibonacci retracements, and an IB forecast. All of these features will be explained in the following sections.
🔹 Custom Sessions and Signals
By default, sessions for Initial Balance and breakout signals are in Auto mode. This means that Initial Balance takes the first hour of the trading session and shows breakout signals for the rest of the session.
With this option, traders can use the tool for open range trading, making it highly versatile. The concept behind open range (OR) is the same as that of initial balance (IB), but in OR, the range is determined by the first minute, three or five minutes, or up to the first 30 minutes of the trading session.
As shown in the image above, the top chart uses the Auto feature for the IB and Breakouts sessions. The bottom chart has the Auto feature disabled to use custom sessions for both parameters. In this case, the first three minutes of the trading session are used, turning the tool into an Open Range trading indicator.
This chart shows another example of using custom sessions to display overnight NASDAQ futures sessions.
The left chart shows a custom session from the Tokyo open to the London open, and the right chart shows a custom session from the London open to the New York open.
The chart shows both the Asian and European sessions, their top and bottom extremes, and the breakout signals from those extremes.
🔹 Initial Balance Extensions
Traders can easily extend both extremes of the Initial Balance to display their preferred targets for breakouts. Enable or disable any of them and set the IB percentage to use for the extension.
As the chart shows, the percentage selected on the settings panel directly affects the displayed levels.
Setting 25 means the tool will use a quarter of the detected initial balance range for extensions beyond the IB extremes. Setting 100 means the full IB range will be used.
Traders can use these extensions as targets for breakout signals.
🔹 Fibonacci Levels
Traders can display default or custom Fibonacci levels on the IB range to trade retracements and assess the strength of market movements. Each level can be enabled or disabled and customized by level, color, and line style.
As we can see on the chart, after the IB was completed, prices were unable to fall below the 0.236 Fibonacci level. This indicates significant bullish pressure, so it is expected that prices will rise.
Traders can use these levels as guidelines to assess the strength of the side trying to penetrate the IB. In this case, the sellers were unable to move the market beyond the first level.
🔹 Initial Balance Forecast
The tool features two different forecasting methods for the current IB. By default, it takes the average of the last ten values and applies a multiplier of one.
IB Against Previous Open: averages the difference between IB extremes and the open of the previous session.
Filter by current day of the week: averages the difference between IB extremes and the open of the current session for the same day of the week.
This feature allows traders to see the difference between the current IB and the average of the last IBs. It makes it very easy to interpret: if the current IB is higher than the average, buyers are in control; if it is lower than the average, sellers are in control.
For example, on the left side of the chart, we can see that the last day was very bullish because the IB was completely above the forecasted value. This is the IB mean of the last ten trading days.
On the right, we can see that on Monday, September 15, the IB traded slightly higher but within the forecasted value of the IB mean of the last ten Mondays. In this case, it is within expectations.
🔶 SETTINGS
Display Last X IBs: Select how many IBs to display.
Initial Balance: Choose a custom session or enable the Auto feature.
Breakouts: Enable or disable breakouts. Choose custom session or enable the Auto feature.
🔹 Extensions
Top Extension: Enable or disable the top extension and choose the percentage of IB to use.
Bottom extension: Enable or disable the bottom extension and choose the percentage of IB to use.
🔹 Fibonacci Levels
Display Fibonacci: Enable or disable Fibonacci levels.
Reverse: Reverse Fibonacci levels.
Levels, Colors & Style
Display Labels: Enable or disable labels and choose text size.
🔹 Forecast
Display Forecast: Select the forecast method.
- IB Against Previous Open: Calculates the average difference between the IB high and low and the previous day's IB open price.
- Filter by Current Day of Week: Calculates the average difference between the IB high and low and the IB open price for the same day of the week.
Forecast Memory: The number of data points used to calculate the average.
Forecast Multiplier: This multiplier will be applied to the average. Bigger numbers will result in wider predicted ranges.
Forecast Colors: Choose from a variety of colors.
Forecast Style: Choose a line style.
🔹 Style
Initial Balance Colors
Extension Transparency: Choose the extension's transparency. 0 is solid, and 100 is fully transparent.

AP Session Liquidity with EQH/EQL and Previous DayThis indicator plots key intraday session highs and lows, along with essential market structure levels, to help traders identify areas of interest, potential liquidity zones, and high-probability trade setups. It includes the Asia Session High and Low (typically 00:00–08:00 UTC), London Session High and Low (08:00–12:00 UTC), New York AM Session High and Low (12:00–15:00 UTC), and New York Lunch High and Low (15:00–17:00 UTC). Additionally, it displays the Previous Day’s High and Low for context on recent price action, as well as automatically detected Equal Highs and Lows based on configurable proximity settings to highlight potential liquidity pools or engineered price levels. These session levels are widely used by institutional traders and are critical for analyzing market behavior during time-based volatility windows. Traders can use this indicator to anticipate breakouts, fakeouts, and reversals around session boundaries—such as liquidity grabs at Asia highs/lows before the London or New York sessions—or to identify key consolidation and expansion zones. Equal Highs and Lows serve as magnets for price, offering insight into potential stop hunts or inducement zones. This tool is ideal for day traders, scalpers, and smart money concept practitioners, and includes full customization for session timings, color schemes, line styles, and alert conditions. Whether you're trading price action, ICT concepts, or supply and demand, this indicator provides a powerful framework for intraday analysis.

[TTM] ICT Sessions & Ranges🌟 Overview 🌟
The ICT Sessions & Ranges Indicator helps traders identify key intraday price levels by marking custom session highs/lows and opening ranges.
It helps traders spot potential liquidity grabs, reversals, and breakout zones by tracking price behavior around these key areas
🌟 Session Highs & Lows – Liquidity Zones 🌟
Session highs and lows often attract price due to stop orders resting above or below them. These levels are frequently targeted during high-volatility moves.
🔹 Asia Session
- Usually ranges in low volatility.
- Highs/lows often get swept during early London.
- Price may raid these levels, then reverse.
🔹 London Session
- First major volatility of the day.
- Highs/lows often tested or swept in New York.
- Commonly forms the day’s true high or low.
🌟 Opening Range Concepts 🌟
The Opening Range is the first 15, 30, or 60 minutes of a session (e.g., New York).
The high (ORH) and low (ORL) define the market’s initial balance and key reaction levels.
🔹 Breakout Trade
- Price breaks ORH/ORL with momentum.
- Signals directional intent.
- Traders enter on the breakout, with stops inside the range.
🔹 Liquidity Raid
- Price briefly breaks ORH/ORL to trigger stops.
- Reverses after the sweep.
- Look for structure shift and entry near FVG or OB.
🌟 Customizable Settings 🌟
The indicator includes 3 configurable ranges , each with:
Start & End Time – Set any custom time window.
Display Type – Choose Box (highlight range) or Lines (mark high/low).
Color Settings – Set custom colors for boxes and lines.
🌟 Default Settings 🌟
Range 1 : 19:00–00:00 (Asia Session)
Range 2 : 01:45–05:15 (London Session)
Range 3 : 09:30–10:00 (NY Opening Range – 30m)

Session Breakouts & Trend Indicator# Session Breakouts & Trend Indicator
This indicator identifies high-probability trading opportunities by tracking key intraday sessions and their breakouts while aligning them with the overall market trend direction.
## What Makes This Indicator Unique
Unlike standard breakout indicators that only identify when price crosses a threshold, this indicator:
- Dynamically identifies and tracks important daily sessions (default: AM 09:00-10:00 and PM 15:00-16:00)
- Determines trend direction using a triple EMA system (20/50/200)
- Shows when breakouts align with the overall trend (higher probability setups)
- Provides visual confirmation with session ranges, breakout levels, and background highlighting
- Includes a comprehensive information panel showing trend/session alignment
## How It Works
The indicator tracks two important daily sessions:
1. **AM Session**: Typically the first hour of trading (default: 09:00-10:00)
2. **PM Session**: Typically the last hour of trading (default: 15:00-16:00)
For each session, it:
- Marks the high and low range
- Establishes breakout levels above/below these ranges
- Detects when price breaks beyond these levels
- Determines if the breakout aligns with the prevailing trend
The trend is calculated using three EMAs (20, 50, 200) for reliable trend identification.
## How To Use
1. Apply the indicator to your chart (works best on 5-minute timeframes)
2. Adjust session times to match your trading schedule if needed
3. Watch for breakouts above session highs (bullish) or below session lows (bearish)
4. Check the information panel to see if the breakout aligns with the trend
5. Enter trades in the direction of trend-aligned breakouts for higher probability setups
6. Set stop losses below the opposite side of the session range
## Settings
- **Session Times**: Customize AM and PM session times
- **EMA Lengths**: Adjust trend determination sensitivity
- **Visualization Options**: Toggle display of sessions, breakouts, and VWAP
- **Alert Settings**: Configure alerts for breakouts and trend-aligned conditions
This indicator is valuable for day traders and swing traders looking for objective entry points with higher probability of success.

Intraday Macro & Flow Indicator# IntraMacroFlow Indicator
## Introduction
IntraMacroFlow is a volume and delta-based indicator that identifies significant price movements within trading sessions. It generates signals when volume spikes coincide with quality price movement, filtered by RSI to avoid overbought/oversold conditions.
> **Note:** This indicator provides multiple signals and should be combined with additional analysis methods such as support/resistance, trend direction, and price action patterns.
## Inputs
### Volume Settings
* **Volume Lookback Period** (14) - Number of bars for volume moving average calculation
* **Volume Threshold Multiplier** (1.5) - Required volume increase over average to generate signals
* **Delta Threshold** (0.3) - Required close-to-open movement relative to bar range (higher = stronger movement)
### Session Configuration
* **Use Dynamic Session Detection** (true) - Automatically determine session times
* **Highlight Market Open Period** (true) - Highlight first third of trading session
* **Highlight Mid-Session Period** (true) - Highlight middle portion of trading session
* **Detect Signals Throughout Whole Session** (true) - Find signals in entire session
* **Session Time** ("0930-1600") - Trading hours in HHMM-HHMM format
* **Session Type** ("Regular") - Select Regular, Extended, or Custom session
### Manual Session Settings
Used when dynamic detection is disabled:
* **Manual Session Open Hour** (9)
* **Manual Session Open Minute** (30)
* **Manual Session Open Duration** (60)
* **Manual Mid-Session Start Hour** (12)
* **Manual Mid-Session End Hour** (14)
## How It Works
The indicator analyzes each bar using three primary conditions:
1. **Volume Condition**: Current volume > Average volume × Threshold
2. **Delta Condition**: |Close-Open|/Range > Delta threshold
3. **Time Condition**: Bar falls within configured session times
When all conditions are met:
* Bullish signals appear when close > open and RSI < 70
* Bearish signals appear when close < open and RSI > 30
## Display Elements
### Shapes and Colors
* Green triangles below bars - Bullish signals
* Red triangles above bars - Bearish signals
* Blue background - Market open period
* Purple background - Mid-session period
* Bar coloring - Green (bullish), Red (bearish), or unchanged
### Information Panel
A dynamic label shows:
* Current volume relative to average (Vol)
* Delta value for current bar (Delta)
* RSI value (RSI)
* Session status (Active/Closed)
## Calculation Method
```
// Volume Condition
volumeMA = ta.sma(volume, lookbackPeriod)
volumeCondition = volume > volumeMA * volumeThreshold
// Delta Calculation (price movement quality)
priceRange = high - low
delta = math.abs(close - open) / priceRange
deltaCondition = delta > deltaThreshold
// Direction and RSI Filter
bullishBias = close > open and entrySignal and not (rsi > 70)
bearishBias = close < open and entrySignal and not (rsi < 30)
```
## Usage Recommendations
### Suitable Markets
* Equities during regular trading hours
* Futures markets
* Forex during active sessions
* Cryptocurrencies with defined volume patterns
### Recommended Timeframes
* 1-minute to 1-hour (optimal: 5 or 15-minute)
### Parameter Adjustments
* For fewer but stronger signals: increase Volume Threshold (2.0+) and Delta Threshold (0.4-0.6)
* For more signals: decrease Volume Threshold (1.2-1.5) and Delta Threshold (0.2-0.3)
### Usage Tips
* Combine with trend analysis for higher-probability entries
* Focus on signals occurring at session boundaries and mid-session
* Use opposite signals as potential exit points
* Configure alerts to receive notifications when signals occur
## Additional Notes
* RSI parameters are fixed at 14 periods with 70/30 thresholds
* The indicator handles overnight sessions correctly
* Fully compatible with TradingView alerts
* Customizable visual elements
## Release Notes
Initial release: This is a template indicator that should be customized to suit your specific trading strategies and preferences.

Pre-London High-Low Breakout IndicatorOverview
The Pre-London High-Low Breakout Indicator helps traders identify breakout opportunities at the London session open. It marks the high and low one hour before London opens (5 PM - 6 PM AEST) and incorporates a 200 SMA filter to confirm trade direction. The indicator also provides real-time breakout markers for precise entries.
How the Indicator Works
1. Pre-London High & Low Identification (5 PM - 6 PM AEST)
The indicator tracks the highest and lowest price levels within this period.
These levels act as key breakout zones once London opens.
The high and low remain visible until 12 AM AEST for reference.
2. 200 SMA as a Trend Filter
A 200 SMA (yellow, thick line) is plotted to filter breakout trades.
Only long (buy) trades are valid if price is above the 200 SMA.
Only short (sell) trades are valid if price is below the 200 SMA.
3. Real-Time Breakout Confirmation
Buy Signal (Green Diamond):
Price breaks above the pre-London high.
Price is above the 200 SMA.
Sell Signal (Red Diamond):
Price breaks below the pre-London low.
Price is below the 200 SMA.
No signal appears if the breakout is against the SMA trend, reducing false trades.
How to Use the Indicator Properly
Step 1: Identify the Pre-London Range (5 PM - 6 PM AEST)
Observe price movements and note the session high & low.
Do not take trades within this period—wait for a clear breakout.
Step 2: Wait for a Breakout After 6 PM AEST
A breakout must occur beyond the session high or low.
The breakout should be clear and decisive, not hovering around the range.
Step 3: Confirm with the 200 SMA
If price is above the 200 SMA, only buy signals are valid.
If price is below the 200 SMA, only sell signals are valid.
If a breakout occurs against the SMA, ignore it.
Step 4: Enter the Trade and Manage Risk
Enter the trade after the breakout candle closes.
Set stop-loss just inside the pre-London range to minimize risk.
Take profit using a 1:2 or 1:3 risk-reward ratio, or trail the stop.
Why This Strategy Works
Pre-London Liquidity Grab: Institutional traders set positions before the London open, making this range significant.
Trend Confirmation with SMA: Reduces false breakouts by filtering trades in the direction of the trend.
Real-Time Breakout Detection: Green and red diamond markers highlight valid breakouts that meet all conditions.
Final Notes
If price breaks out but quickly reverses, it may be a false breakout—avoid impulsive trades.
The indicator works best when combined with other confluences such as volume analysis or key support/resistance levels.
Alerts can be added to notify traders when a valid breakout occurs.
This setup is ideal for traders looking for a structured, rule-based approach to trading London session breakouts with a strong trend confirmation mechanism.

FT SessionsFT Sessions
Overview
The FT Sessions is a highly customizable and powerful indicator designed for intraday traders who focus on session-based analysis. This script visually highlights global market sessions—Asia, Frankfurt, London, and New York (AM & PM)—on the chart, making it easier to track session ranges and analyze intraday price movements.
Key Features
Customizable Session Times and Colors:
Define your own session times and assign unique colors for better visibility.
Session Range Visualization:
Displays high and low ranges for each session.
Optional transparent range areas with outlines for clarity.
Configurable session range labels for enhanced readability.
Flexible Timezone Settings:
Choose a UTC offset or sync with the exchange's timezone.
User-Friendly Customization:
Compact settings for easier adjustments.
Enable or disable specific sessions to focus on relevant market activity.
How This Script Differs from LuxAlgo
This script draws inspiration from LuxAlgo's session tracking concept but has been developed with significant modifications and unique features:
Built from Scratch in Pine Script v5:
Fully optimized for Pine Script’s latest version, improving performance and functionality.
Expanded Session Range Features:
Five unique sessions (Asia, Frankfurt, London, New York AM, New York PM) with customizable ranges, colors, and labels.
Real-time updating of session ranges for improved intraday analysis.
4H Timeframe Optimization:
Automatically notifies users if applied to an unsupported timeframe, ensuring session accuracy.
Highly Configurable Input Options:
Advanced timezone handling and compact session management settings.
Unique Coding Structure:
Designed to maximize efficiency and minimize resource usage on TradingView.
While LuxAlgo focuses on session concepts, this script brings a fresh, customizable approach specifically tailored for intraday traders seeking precision in tracking session activity.
How It Works
The indicator tracks price movements within each session.
Highlights the high and low range of each session directly on the chart.
Updates session ranges in real-time to reflect evolving market conditions.
Practical Applications
Intraday Trading: Plan trades based on major market session ranges.
Breakout Strategies: Use session high and low levels to identify potential breakouts.
Session-Specific Patterns: Spot consolidations and reversals within session activity.
Important Notes
Optimized for the 4H timeframe. If applied to another timeframe, a notification will appear.
Best used in combination with other tools (e.g., volume or trend indicators) for a complete trading strategy.
Credits
This script draws inspiration from LuxAlgo's open-source session-tracking methodology. However, it introduces substantial improvements and unique features that set it apart. Full credit is given to LuxAlgo for their original open-source concept.
Disclaimer
This script is for informational and educational purposes only. Always test on a demo account before applying to live markets.

Key Prices & LevelsThis indicator is designed to visualize key price levels & areas for NY trading sessions based on the price action from previous day, pre-market activity and key areas from NY session itself. The purpose is to unify all key levels into a single indicator, while allowing a user to control which levels they want to visualize and how.
The indicator identifies the following:
Asia Range High/Lows, along with ability to visualize with a box
London Range High/Lows, along with ability to visualize with a box
Previous Day PM Session High/Lows
Current Day Lunch Session High/Lows, starts appearing after 12pm EST once the lunch session starts
New York Open (8:30am EST) price
9:53 Open (root candle) price
New York Midnight (12:00am EST) price
Previous Day High/Lows
First 1m FVG after NY Session Start (after 9:30am), with the ability to configure minimum FVG size.
Opening Range Gap, showing regular market hours close price (previous day 16:15pm EST close), new session open price (9:30am EST open) and optionally the mid-point between the two
Asia Range 50% along with 2, 2.5, 4 and 4.5 deviations of the Asia range in both directions
Configurability:
Each price level can be turned off
Styles in terms of line type, color
Ability to turn on/off labels for price levels and highlighting of prices on price scale
Ability to control label text for price levels
How is it different:
Identifies novel concepts such as 9:53 open, root candle that can be used as a bounce/resistance area during AM/PM sessions as well as confirmation of direction once closed over/under to indicate price's willingness to continue moving in the same direction.
It also shows 1st 1m FVG after New York Session open, that can be used to determine direction of the price action depending on PA's reaction to that area. While both 9:53 and 1m FVG are 1m based markers, these levels are visualized by the indicator on all timeframes from 15s to 1h.
Additionally the indicator is able to both highlight key prices in the price scale pane as well as combine labels to minimize clutter when multiple levels have the same price.
Lastly for in-session ranges such as Lunch High/Low the indicator updates the range in real-time as opposed to waiting for the lunch session to be over.
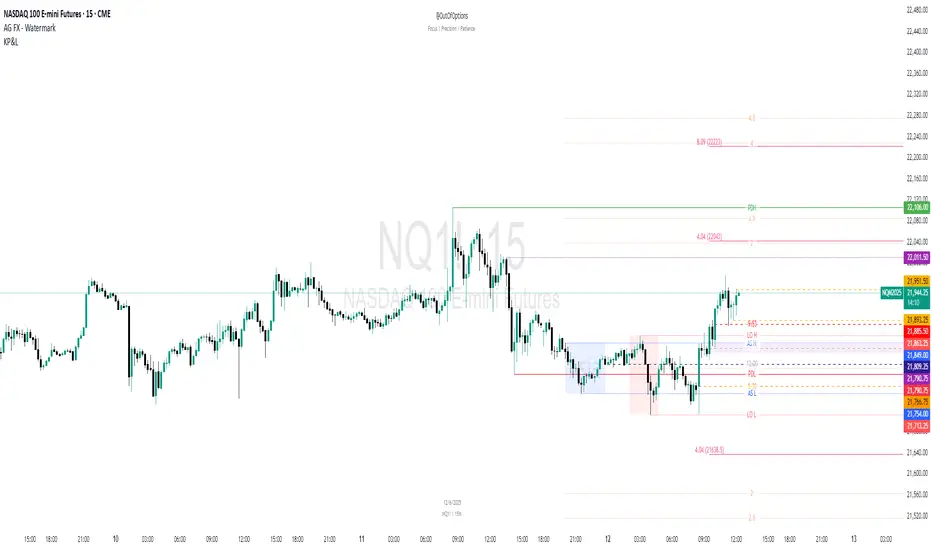
Session Range Breakouts With Targets [AlgoAlpha]⛓️💥Session Range Breakouts With Targets 🚀
Introducing the "Session Range Breakouts With Targets" indicator by AlgoAlpha, a powerful tool for traders to capitalize on session-based range breakouts and identify precise target zones using ATR-based calculations! Whether you trade the Asian, American, European, or Oceanic sessions, this script highlights key breakout levels and targets that adapt to market volatility, ensuring you're always prepared for those crucial price movements. 🕒📊
Session-based Trading : The indicator highlights session-specific ranges, offering clear breakouts for Asian, American, European, Oceanic, and even custom sessions 🌍.
Adaptive Volatility Zones : Uses ATR to determine dynamic zone widths, filtering out fakeouts and adjusting to market conditions ⚡.
Precise Take-Profit Targets : Set multiple levels of take-profits based on ATR multipliers, ensuring you can manage both aggressive and conservative trades 🎯.
Customizable Appearance : Tailor the look with customizable colors for session highlights and breakout zones to fit your chart style 🎨.
Alerts on Key Events : Built-in alert conditions for breakouts and take-profit hits, so you never miss a trading opportunity 🔔.
🚀 Quick Guide to Using the Indicator
🛠 Add the Indicator : Add the indicator to favorites by pressing the star icon. Choose your session (Asia, America, Europe, Oceana, or Custom) and adjust the ATR length, zone width multiplier, and target multipliers to suit your strategy.
📊 Analyze Breakouts : Watch for the indicator to plot upper and lower range boxes based on session highs and lows. Price breaking through these boxes will signal a potential entry.
📈 Monitor Targets : Track bullish and bearish targets as price moves, with up to three take-profit levels based on ATR multipliers.
🔔 Set Alerts : Enable alerts for session breakouts or when price hits your designated take-profit targets.
🔍 How It Works
This script operates by identifying session-specific ranges based on highs and lows from the beginning of the selected session (Asia, America, Europe, or others). After a user-defined wait period (default: 120 bars), it calculates the highest and lowest points and creates upper and lower zones using the Average True Range (ATR) to adapt to market volatility. If the price breaks above or below these zones, it is identified as a breakout, and the script dynamically calculates up to three take-profit targets for both bullish and bearish scenarios using an ATR multiplier. The indicator also includes alerts for breakouts and take-profit hits, providing real-time trading signals.
